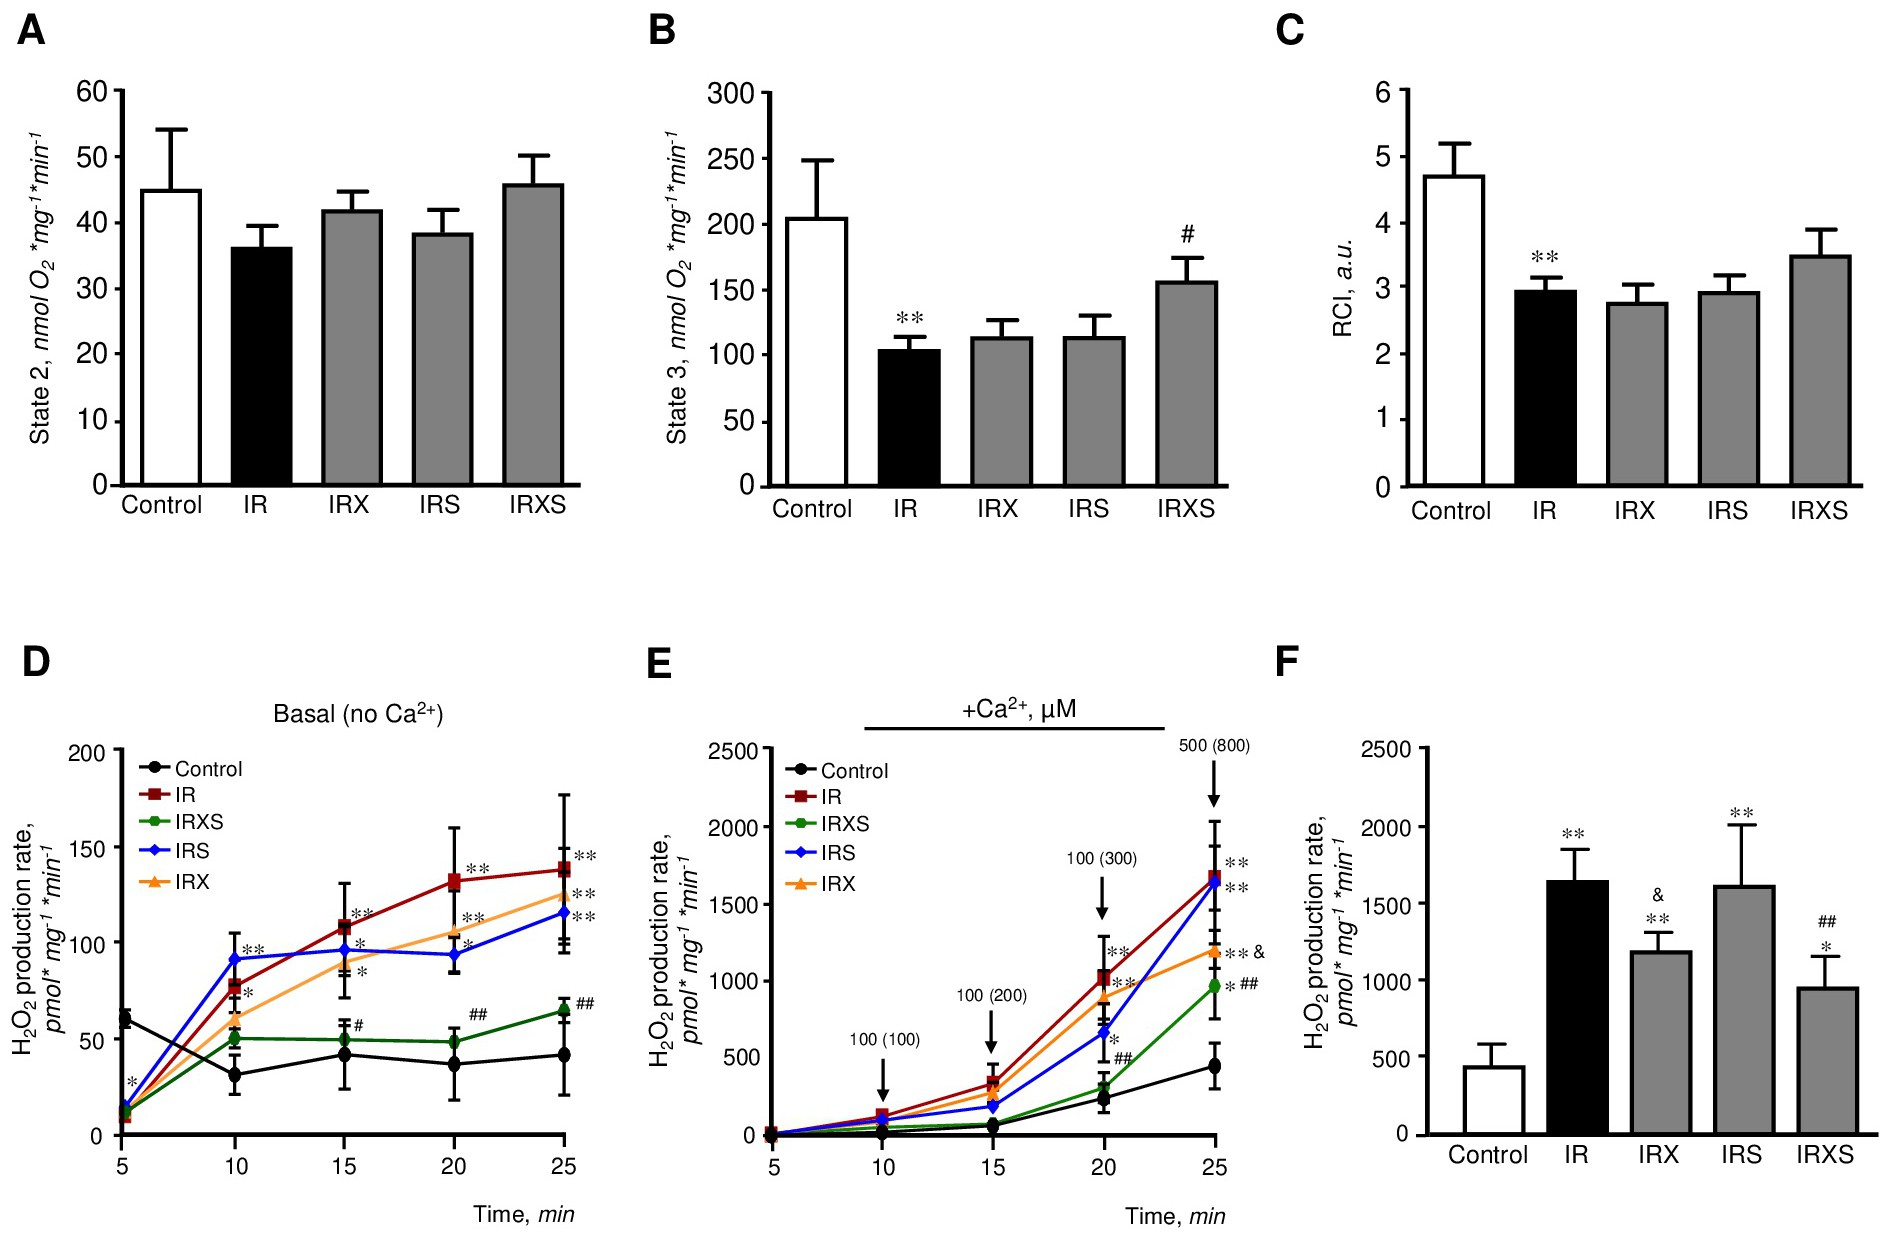
Fig. 3. Mitochondrial respiration and mtROS production. State 2 (A) and State 3 (B) respiration rates, and respiratory control index (RCI, C) for complex I, and basal (no Ca2+, D) and Ca2+-induced (E, F) mtROS production rates. Ca2+-induced mtROS production rates are shown for all time points (E) and for the maximum (25 min) measurement time (F) Mitochondrial respiration rates were measured in isolated mitochondria using substrates for complexes I (α-ketoglutarate and L-malate) in the absence (state 2) or presence of ADP (state 3). Oxygen consumption is defined as nmol of O2 per minute in 1 mg of protein. RCI was measured as the ratio of state 3 to state 2. Basal and Ca2+-induced mtROS production was measured with Ampliflu Red for 25 min with 5-min intervals by monitoring the increase in fluorescence at excitation/emission of 560/590 nm. Groups: Con, control (black circle); IR, ischemia-reperfusion (red square); IRX, IR+XJB (orange triangle); IRS, IR+SfA (blue diamond); IRXS, IR+XJB+SfA (green hexagon). *P<0.05, **P<0.01 all groups vs. Con; &P<0.05 IRX vs. IR; #P<0.05, ##P<0.01 IRXS vs. IR. n= 6-7 per each group.